 Deno 中文文档
调试代码
Deno supports the V8 Inspector Protocol used by Chrome, Edge and Node.js. This makes it possible to debug Deno programs using Chrome DevTools or other clients that support the protocol (for example VSCode).
要调试,请使用 ——inspect 或 ——inspect-brk 标志来运行 Deno。
——inspect 标志允许在任何时间点连接调试器,而 ——inspect-brk 将等待调试器连接,并在第一行代码时暂停执行。
⚠️ If you use
--inspectflag, the code will start executing immediately. If your program is short, you might not have enough time to connect the debugger before the program finishes execution. In such cases, try running with--inspect-brkflag instead, or add a timeout at the end of your code.
Chrome Devtools
让我们用 Chrome Devtools 来调试一个程序。为此,我们使用一个来自 Deno 标准库的静态文件服务器 file_server.ts 。
使用 ——inspect-brk 标志在第一行中断执行:
$ deno run --inspect-brk --allow-read --allow-net https://deno.land/std@$STD_VERSION/http/file_server.ts
Debugger listening on ws://127.0.0.1:9229/ws/1e82c406-85a9-44ab-86b6-7341583480b1
Download https://deno.land/std@$STD_VERSION/http/file_server.ts
Compile https://deno.land/std@$STD_VERSION/http/file_server.ts
...
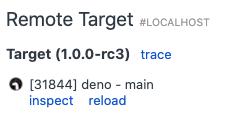
In a Chromium derived browser such as Google Chrome or Microsoft Edge, open
chrome://inspect and click Inspect next to target:
It might take a few seconds after opening the DevTools to load all modules.
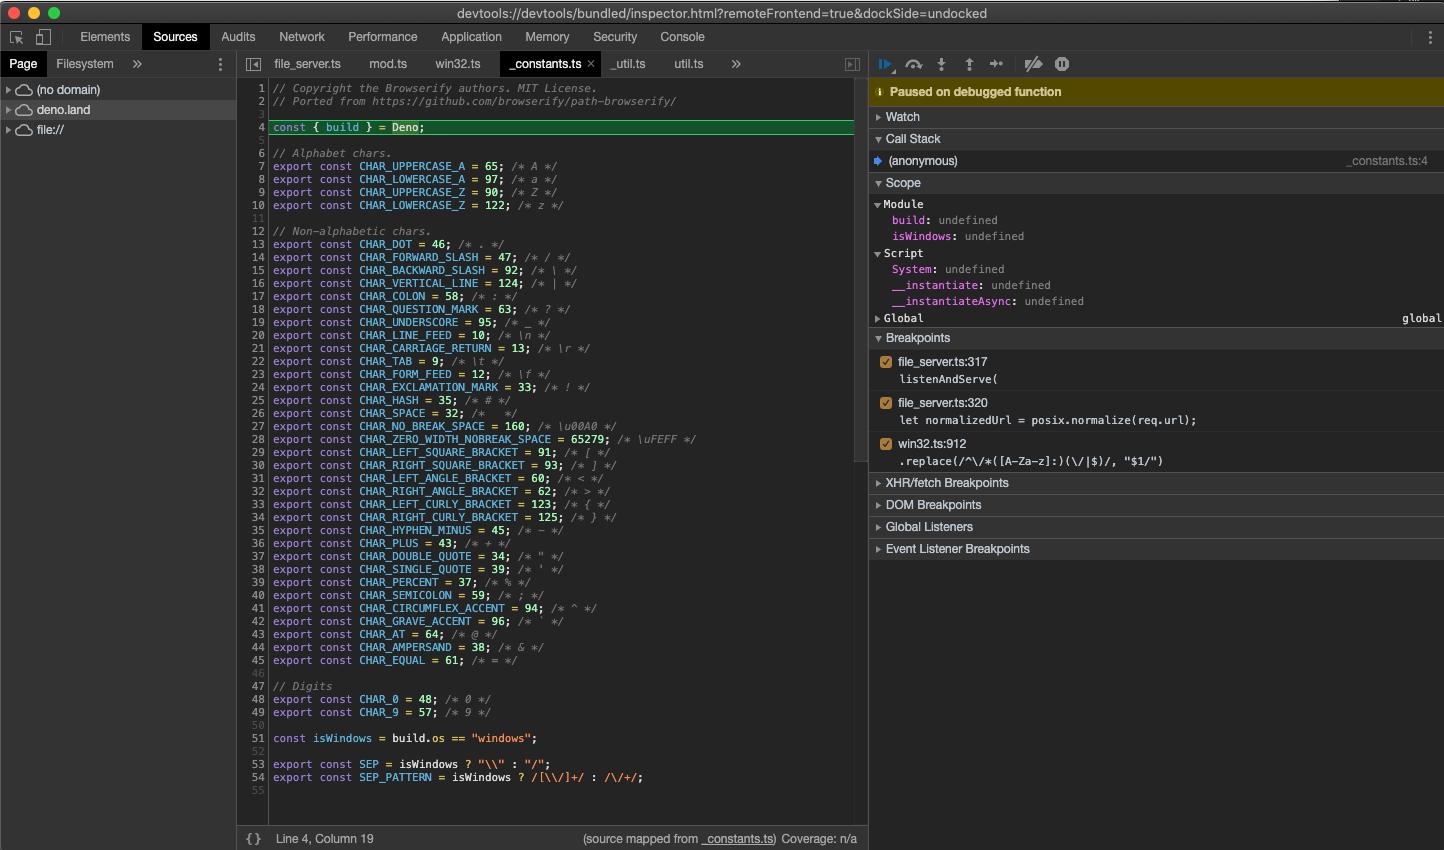
You might notice that DevTools pauses execution on the first line of
_constants.ts instead of file_server.ts. This is expected behavior caused by
the way ES modules are evaluated in JavaScript (_constants.ts is left-most,
bottom-most dependency of file_server.ts so it is evaluated first).
At this point all source code is available in the DevTools, so let's open up
file_server.ts and add a breakpoint there; go to "Sources" pane and expand the
tree:
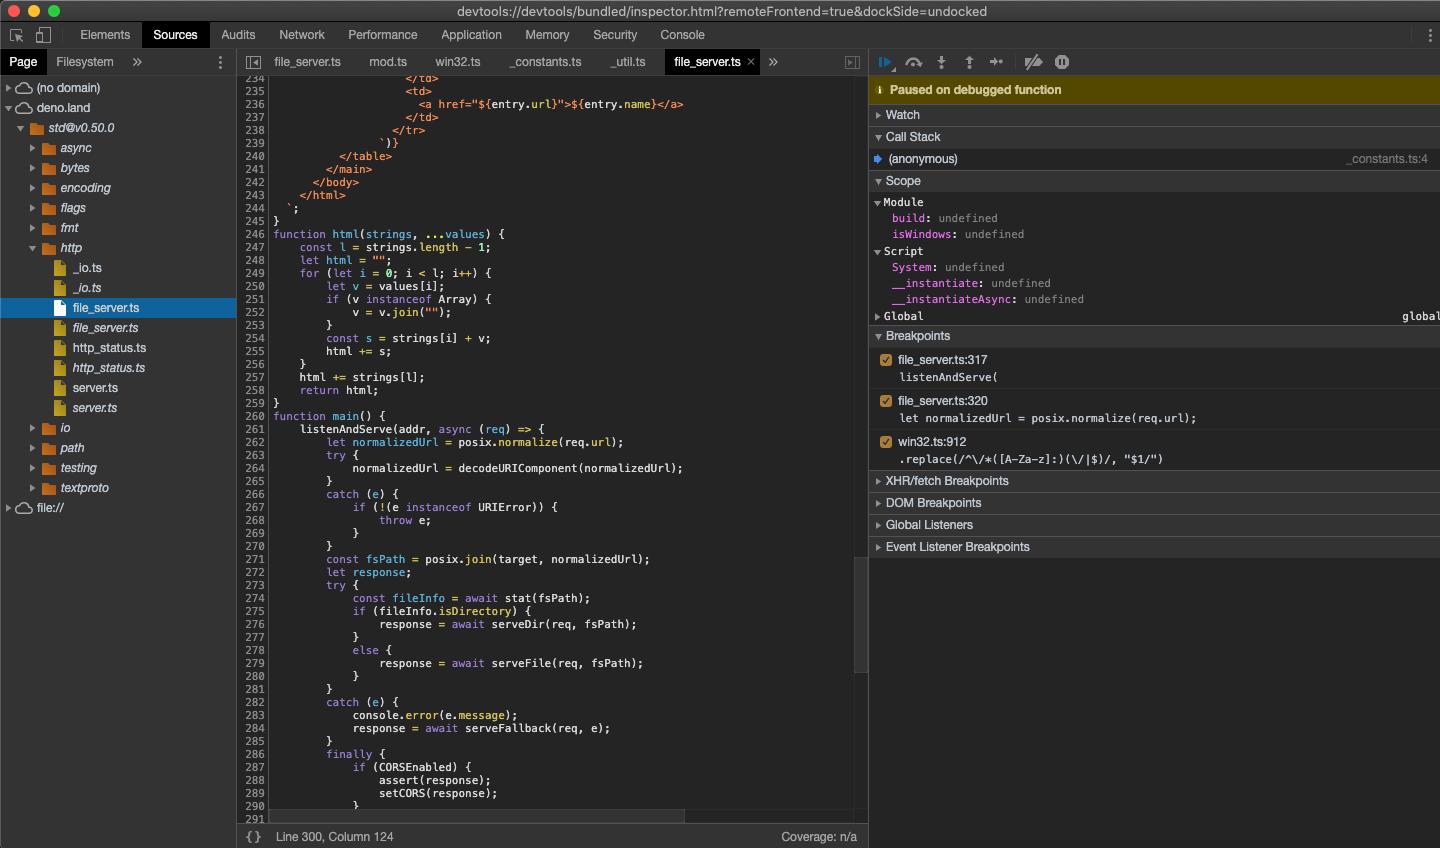
仔细观察,您会发现每个文件都有重复;一份是常规字体,另一份是斜体。前者是编译后的源文件(因此,在 .ts 文件的情况下,它将作为 JavaScript
输出),而后者是该文件的 SourceMap。
接下来,在 listenAndServe 方法中添加一个断点:
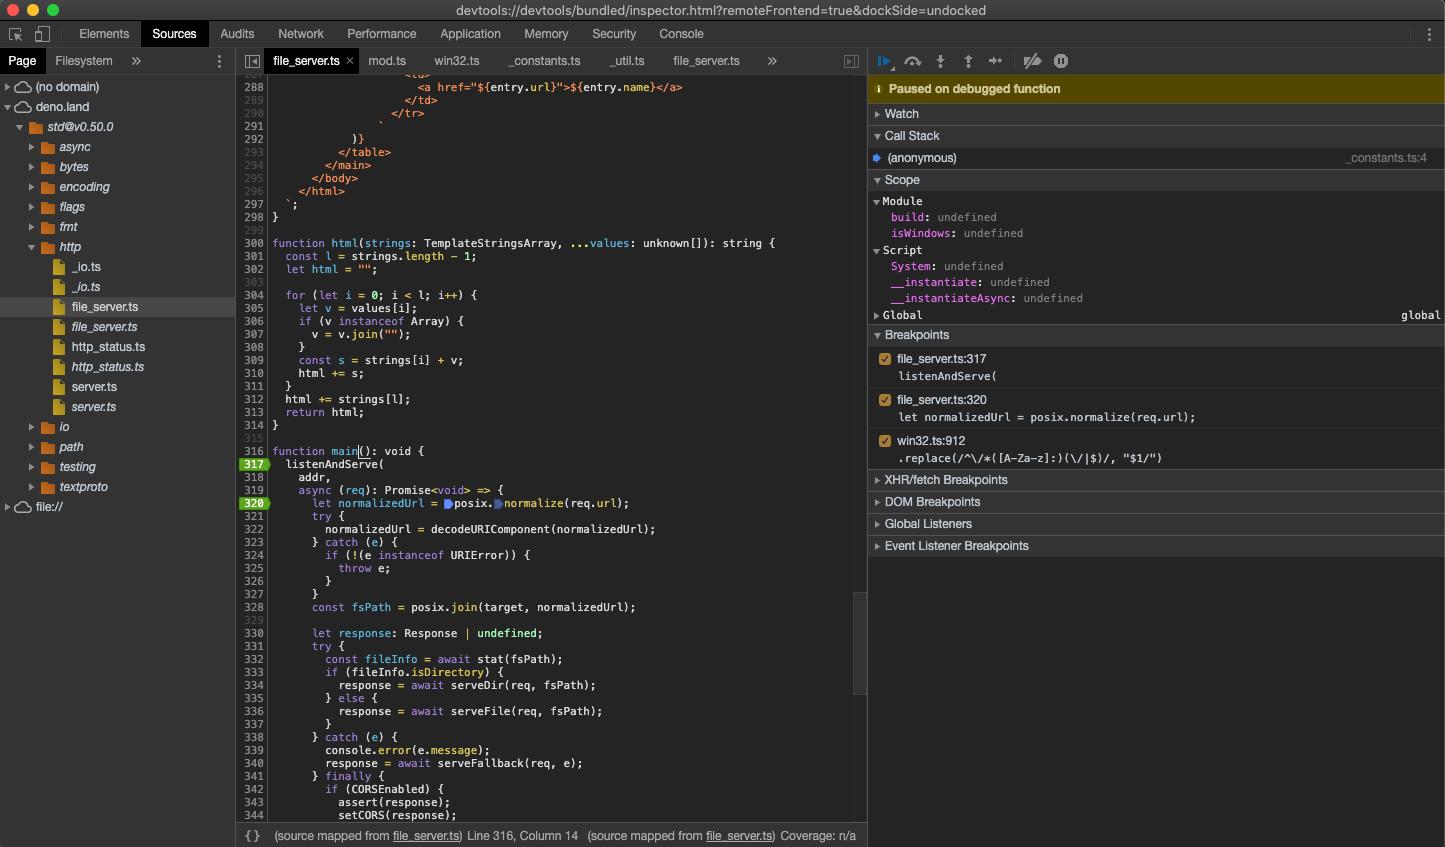
As soon as we've added the breakpoint, DevTools automatically opens up the source map file, which allows us step through the actual source code that includes types.
Now that we have our breakpoints set, we can resume the execution of our script so that we can inspect an incoming request. Hit the "Resume script execution" button to do so. You might even need to hit it twice!
Once our script is running, try send a request and inspect it in Devtools:
$ curl http://0.0.0.0:4507/
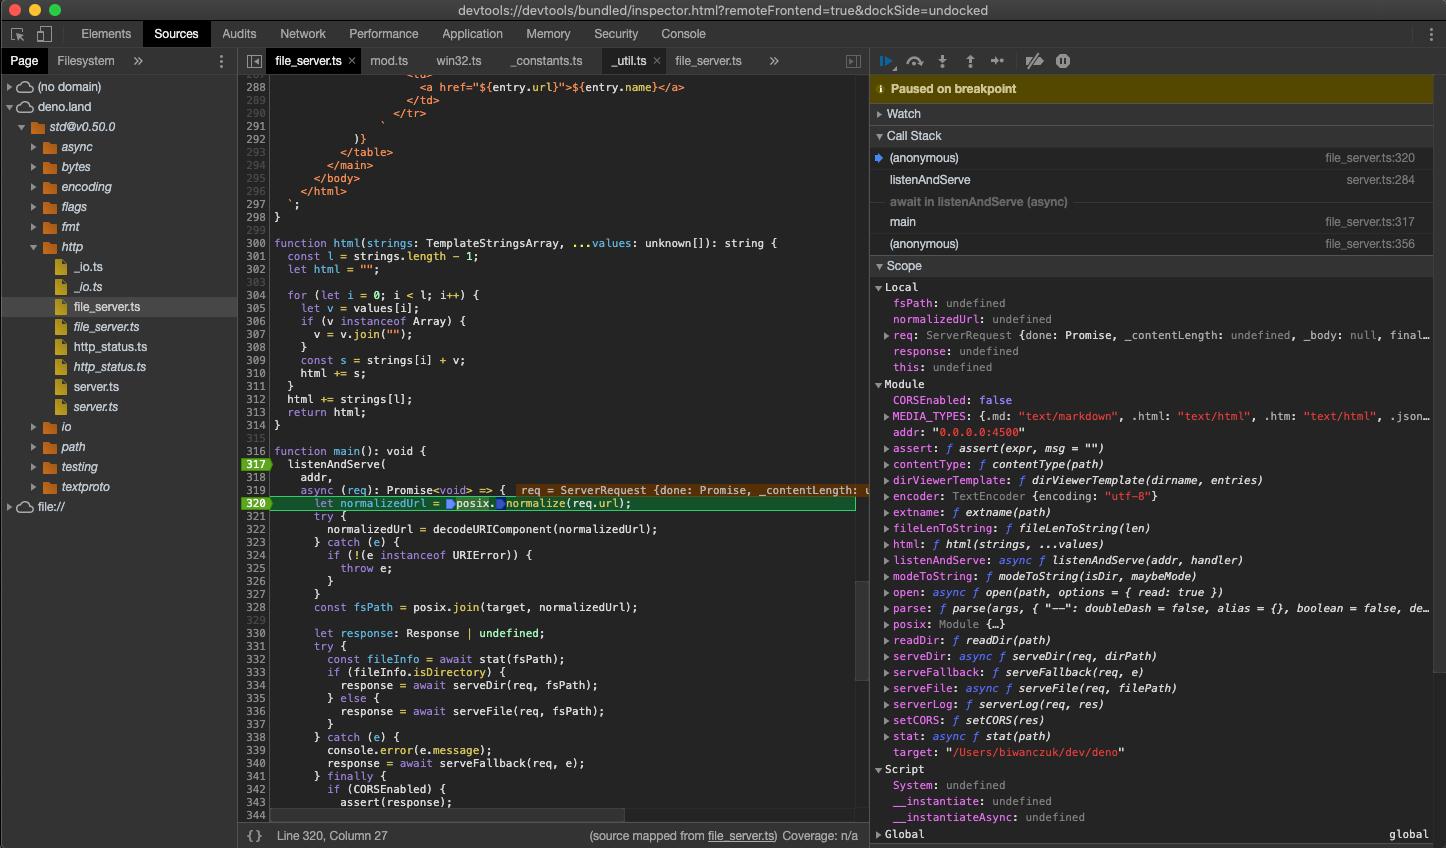
在这一点上,我们可以内省请求的内容,并逐步调试代码。
VSCode
Deno can be debugged using VSCode. This is best done with help from the official
vscode_deno extension. Documentation for this can be found
here .
JetBrains IDEs
Note: make sure you have this Deno plugin installed and enabled in Preferences / Settings | Plugins. For more information, see this blog post .
You can debug Deno using your JetBrains IDE by right-clicking the file you want
to debug and selecting the Debug 'Deno: <file name>' option.
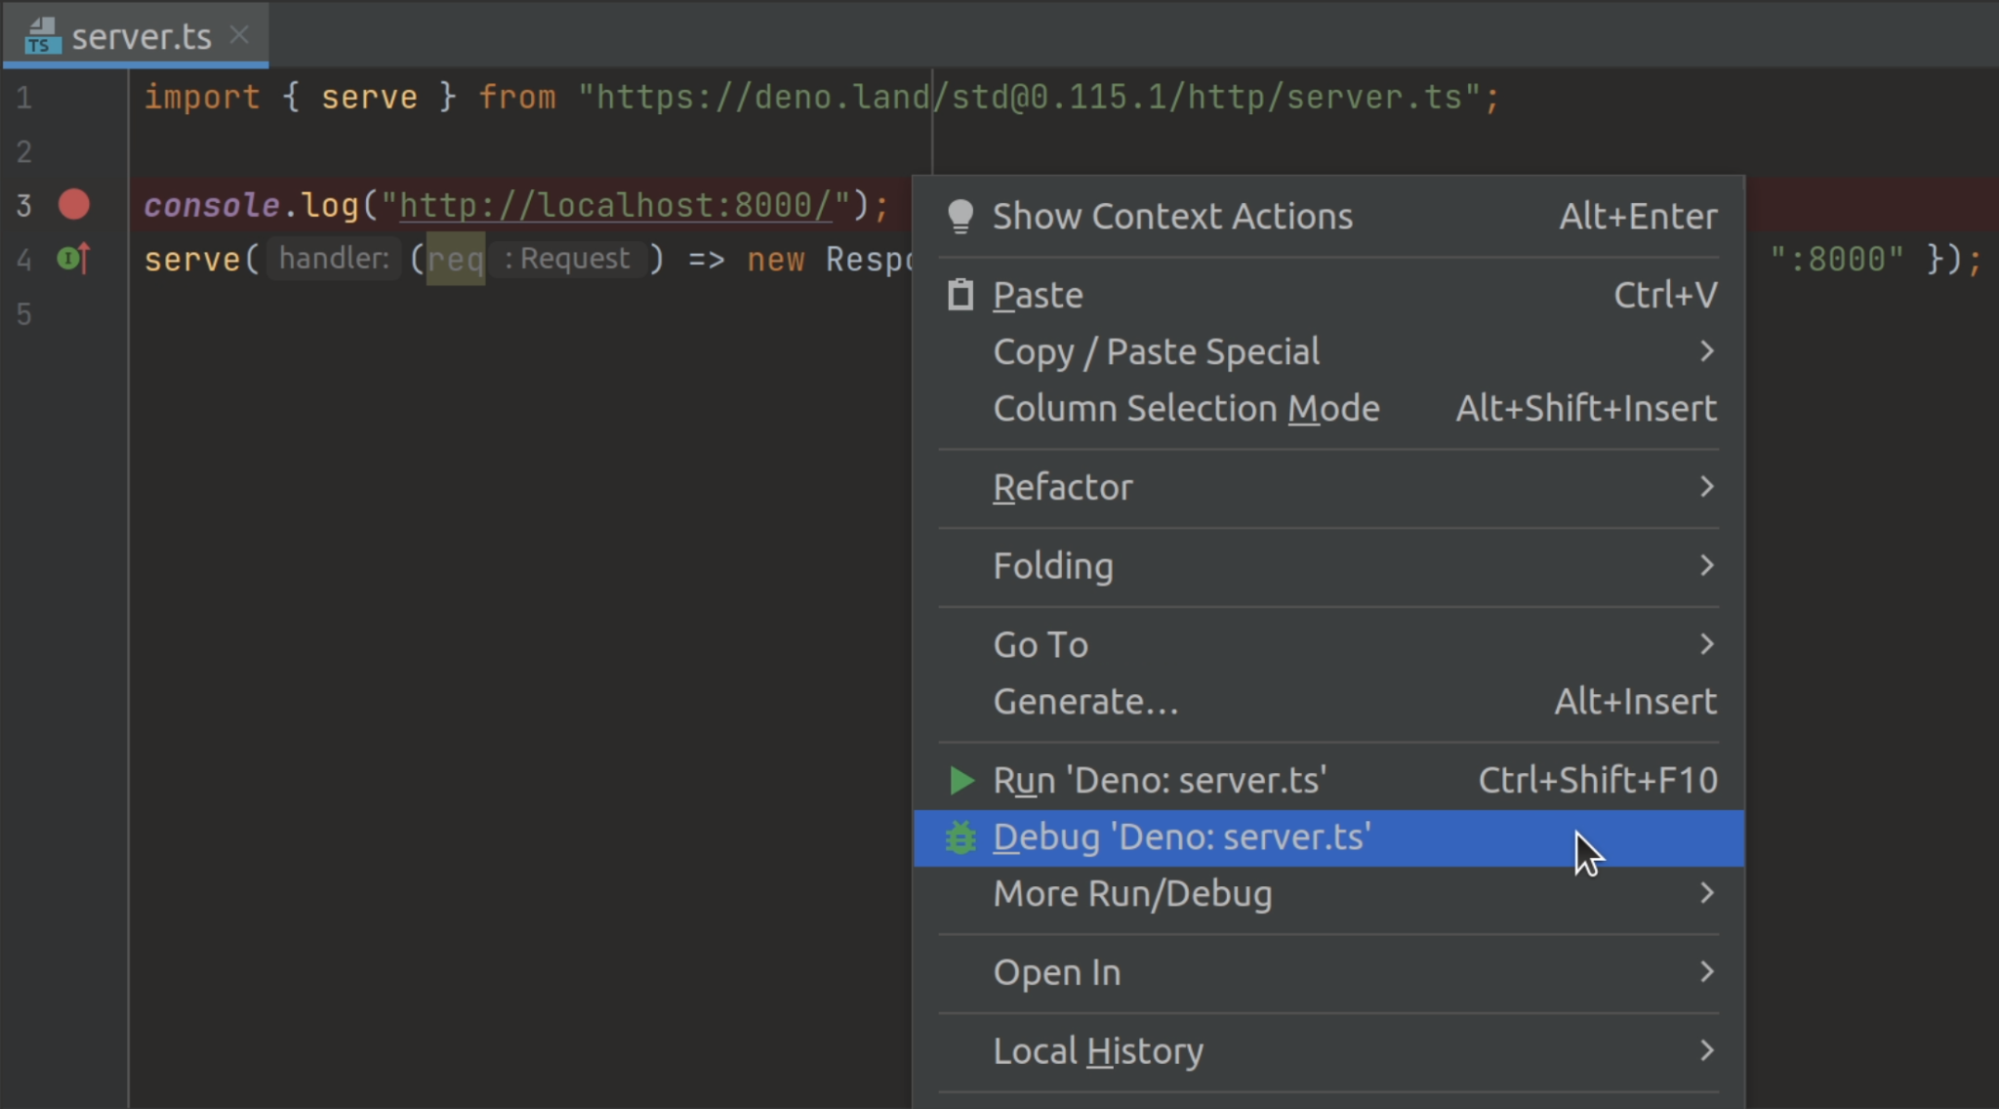
This will create a run/debug configuration with no permission flags set. If you
want to configure them, open your run/debug configuration and add the required
flags to the Command field.
其他
Any client that implements the DevTools protocol should be able to connect to a Deno process.